City College, Fall 2018
Intro to Data Science
Week 3: Processing and Cleaning Data
September 17, 2018Today's Agenda
- Why Data Cleaning is Important
- Elements of the ETL Process
- Processing Tools
- Handling Missing Data
Week 2 Recap
- Structured vs. Unstructured Data
- Where Data Comes From: DBs, APIs, Flat Files, Web Scraping
- Sources of Data: Government, Private Firms, Personal
- Packages: Pandas, Requests, Beautiful Soup
Assignment 2 Recap
- How was DataCamp?
- Jupyter Issues
- Interesting Findings in the Film Permit Data
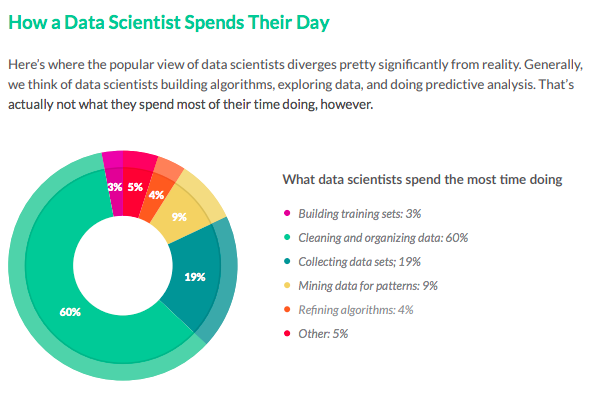
Source: CrowdFlower Data Science Report, 2016
Kaggle founder and CEO Anthony Goldbloom:
80 percent of data science is cleaning the data and 20 percent is complaining about cleaning the data
ETL


- Broadly: gathering input data from source(s)
- Practically: capturing and recording events
- Broadly: convert raw event data to usable form; enforce data model
- Practically: applying rules and functions to extracted data
- Rules: split, group, drop
- Transformations: map, apply, normalize
- Broadly: Push transformed data to datastore
- Practically: Publish data in usable form
- Database, flat file, api
- Dashboard, table, report
This Can Get Complex

ETL Tools
Bash Scripts


ETL Process Stakeholders

Handling Missing Values
- Drop observations with missing fields.
- Impute values:
- Central tendancy: median, mean, mode.
- Modeled value.
We'll touch on this throughout the rest of the course.
Handling Outliers
- Drop.
- Trim.
- Be mindful.
We'll touch on this throughout the rest of the course.
Normalizing Data
- Adjust range.
- Adjust scale.
We'll touch on this throughout the rest of the course.


Wrap Up
- Why Data Cleaning is Important
- Elements of the ETL Process
- Processing Tools
- Handling Missing Values
Project: Components
- Apply Python to load, clean, and process data sets.
- Identify key elements of and patterns in your data set using computational analysis and statistical methods.
- Apply principles of statistical modeling and machine learning to your data.
- Explain, visualize, and communicate empirical findings within your analysis.
- Demonstrate effective team collaboration
Project: Teams
- Four people per group.
- Requests to work together will be honored to the extent practical.
- Contributions to the team's efforts, as measured by GitHub commits and peer review, will be a significant portion of the project grade.
Project: Data Resources
- Kaggle Datasets
- Data.gov
- Google Dataset Search (New!)
- This list, and other lists on the internet
- (Legal, Responsible, Ethical) Web Scraping!
Be Creative
Project: Key Dates (Tentative)
- Project Teams Formed, October 1.
- Project Proposals Due via Email, October 15.
- First Project Update, November 5.
- Second Project Update, November 26.
- Projects Due Finals period.
Be Creative
Assignment 3: Due Monday, September 24 by 6:30pm
Part I: DataCamp's Statistical Thinking in Python (Part 1)
- The course should appear as assignment within your existing DataCamp account.
- Course takes ~3 hours, plan your time accordingly.
Part II: Project Prep
- Identify three datasets you're interested in using for your project, including at least two that we have not discussed in class.
- For each of the three datasets, identify a question you'd like to use the data to answer.
- For one of the data sets we have not discussed in class, provide one interesting summary statistic and one chart, and explain why you find this interesting. If you already have a team in mind, feel free to collaborate, but each team member must provide their own unique answer (chart and stat) to this question.
- (Optional) List up to three of your classmates you'd like to work with.
- Submit a word or pdf file to Blackboard with your response.