City College, Fall 2019
Intro to Data Science
Week 8: Performance Evaluation and Ensemble Models
October 28, 2019Today's Agenda
- Model Fit
- Anomaly Detection
- Ensemble Models
- Random Forests
- Gradient Boosting Machines
- Midterm Recap
Part I
Evaluating Model Performance
Did we see this coming?
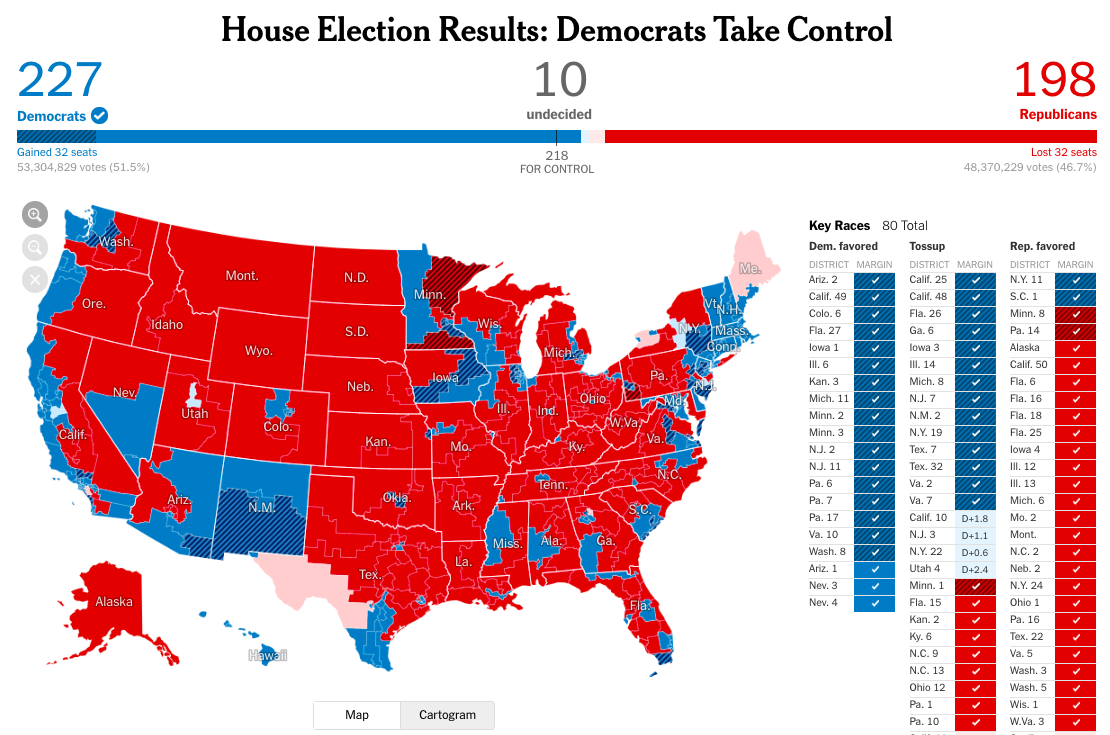
Democratic strategist David Axelrod predicted that poll performance “is going to prompt another round of soul-searching about whether and how you can poll accurately, because a lot of these races that were blowouts tonight or apparently blowouts tonight polled as tough races.”
Democratic pollster Andrew Baumann called the pre-election polls “quite accurate, particularly for a midterm that ended up being totally different than any previous midterm.”
Was this true?
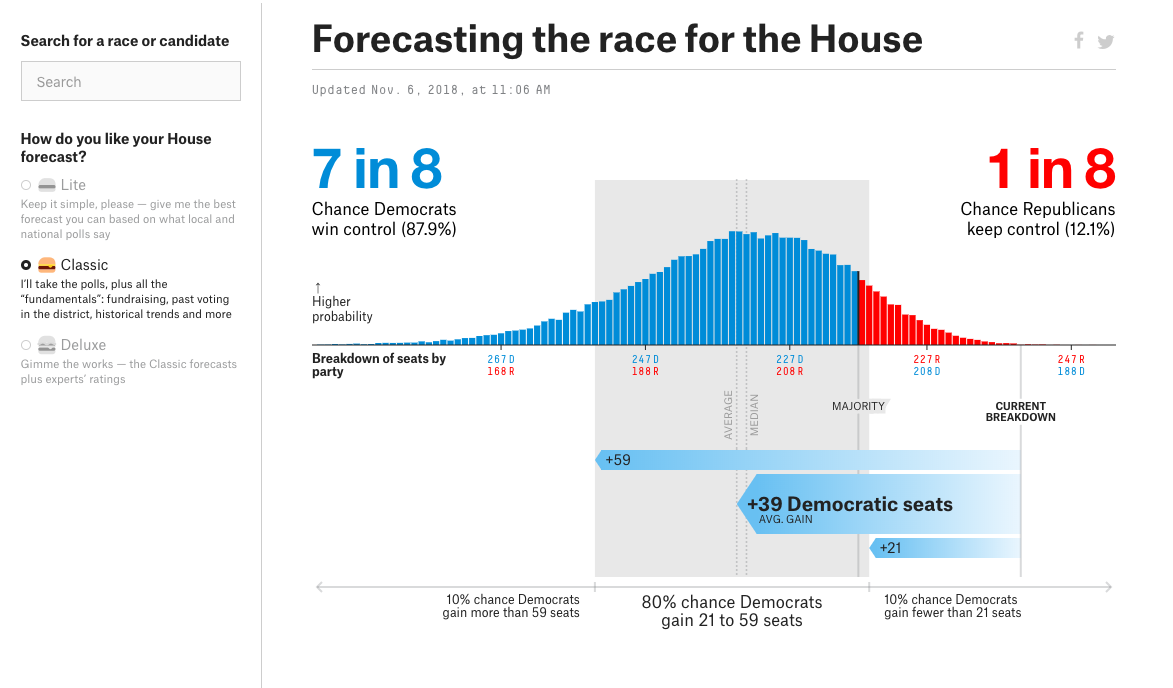
538 Prediction Results
| Actual Dem | Actual Rep | |
|---|---|---|
| Predicted Dem | 226 | 2 |
| Predicted Rep | 9 | 197 |
Based on 538 deluxe model for 11/05/18.
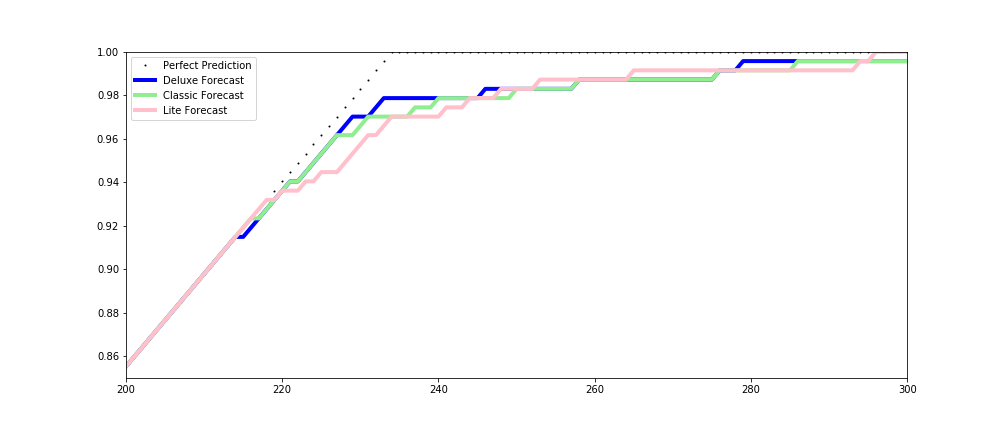
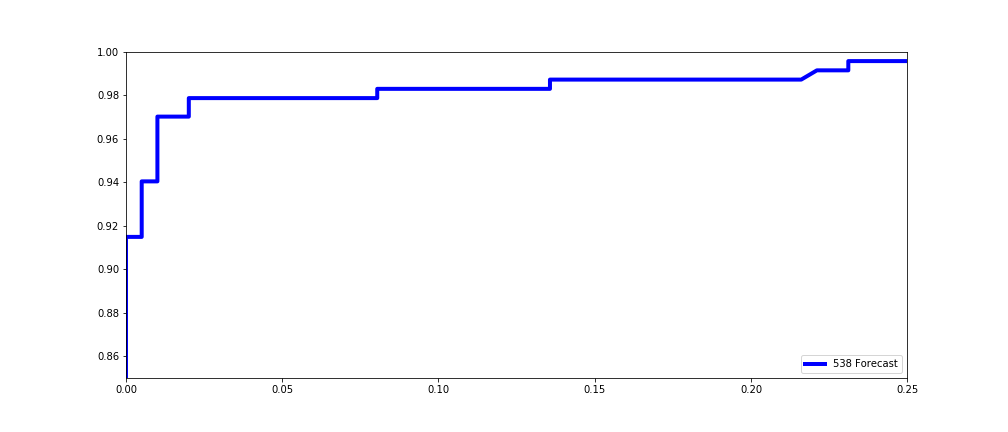
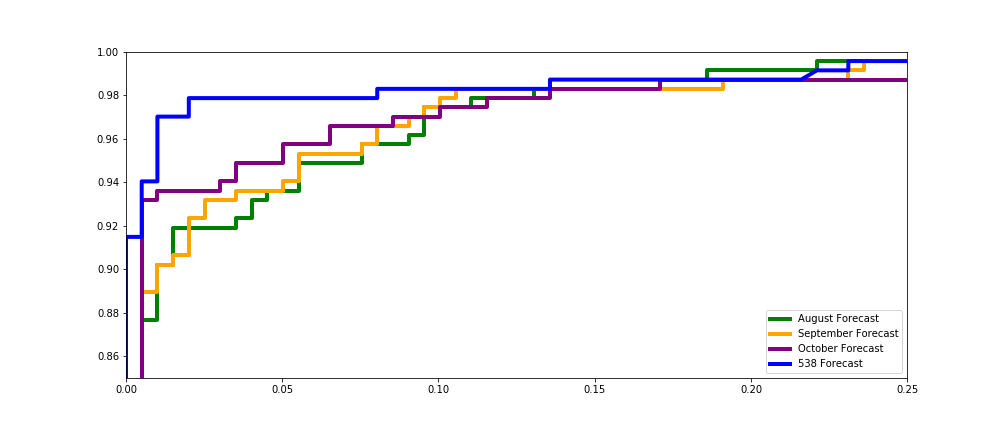
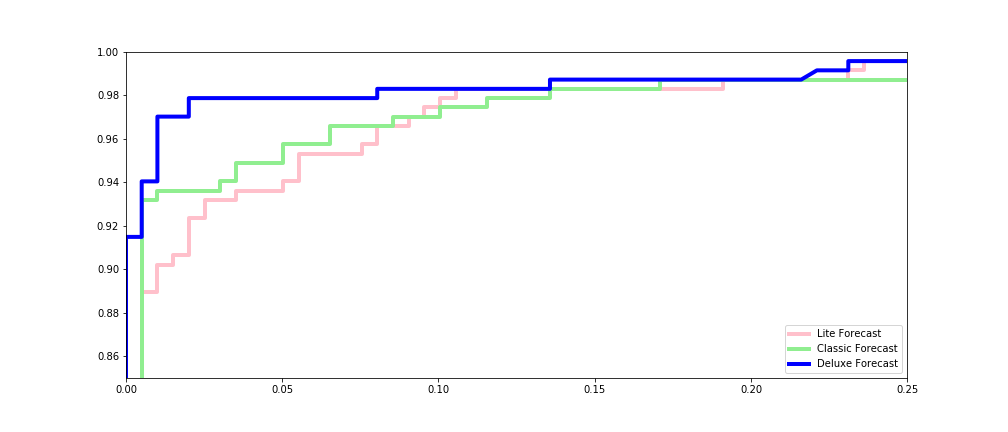
Lift Charts
Rank all observations by the predicted probability class, and chart the cummulative share of actual true values captured by the first x observations, where x ranges from 1 to the total number of observations.
Demonstrates model's ability to outperform other (random) choices at positive prediction across decision thresholds.
For more details.
538 Lift
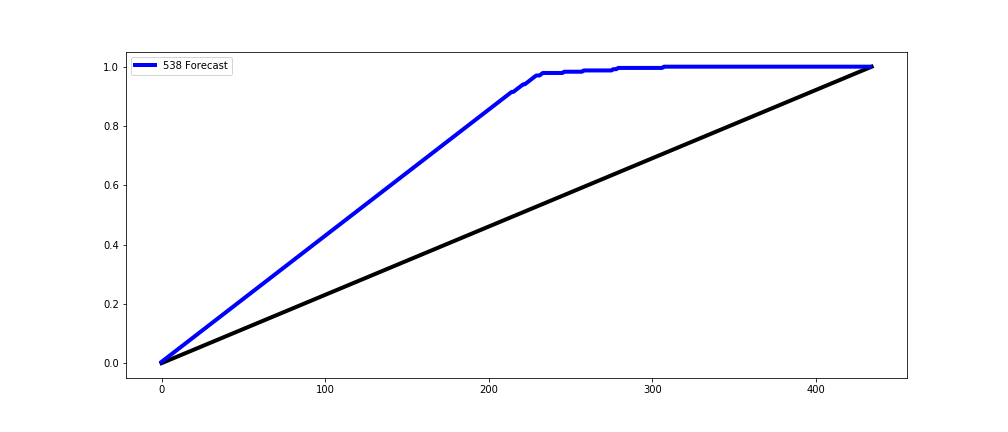
538 Lift
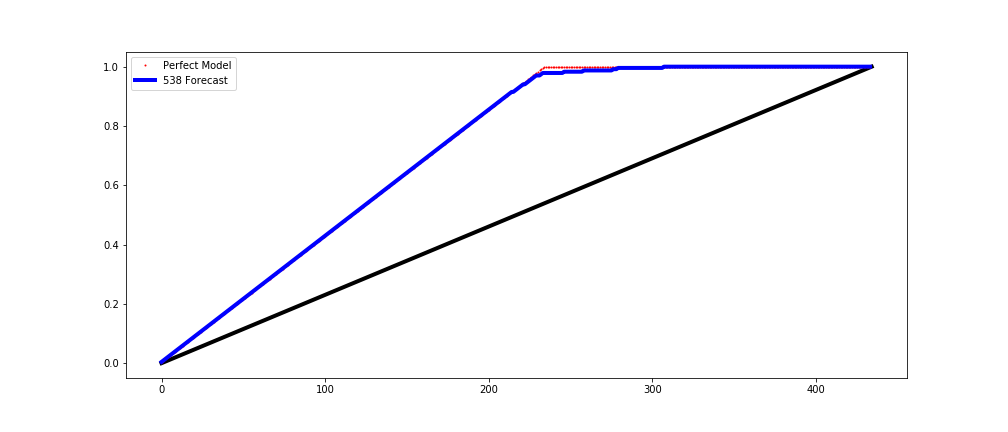
538 Lift
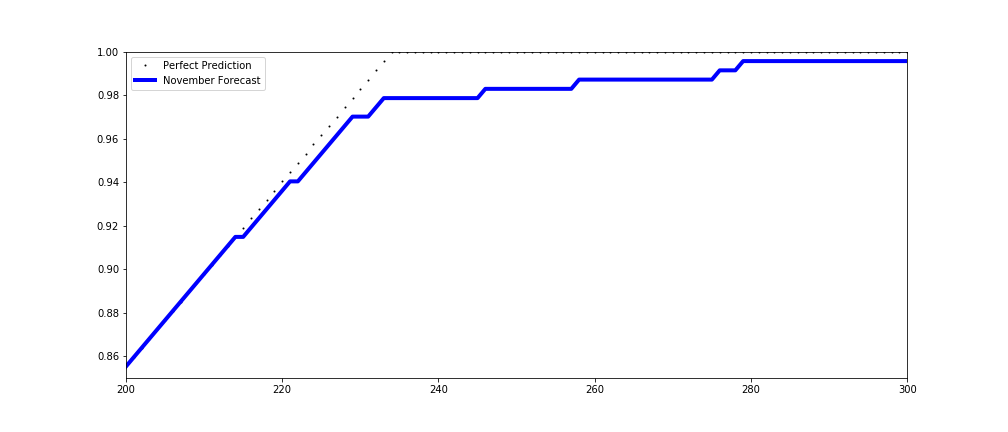
538 Lift
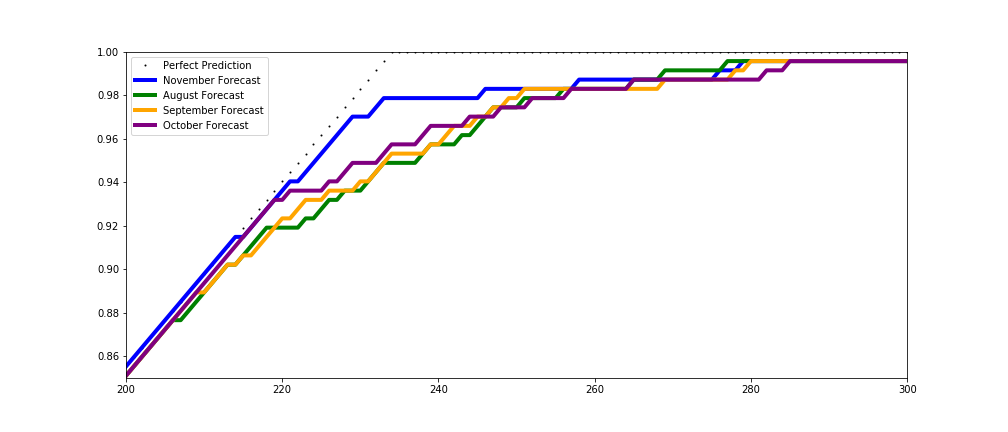
538 Lift
ROC Curves
ROC = Receiver Operating Characteristic
Plot the true positive rate against the false positive rate at every possible threshold from highest to lowest.
Demonstrates model's ability to outperform other (random) choices across decision thresholds while weighing false positives against false negatives.
For more details.
538 ROC
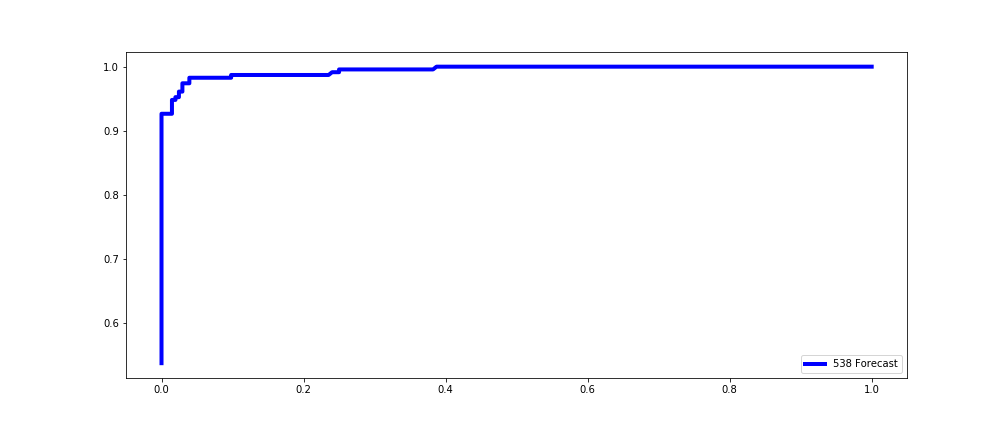
538 ROC
538 ROC
538 ROC
AUC
AUC = Area Under the Curve
Total volume of area under the ROC curve.
Sci-kit Learn can calculate this for you.A Digression
538 Prediction Results
| Actual Dem | Actual Rep | Total | |
|---|---|---|---|
| Predicted Dem | 226 | 2 | 228 |
| Predicted Rep | 9 | 197 | 206 |
| Total | 235 | 199 | 434 |
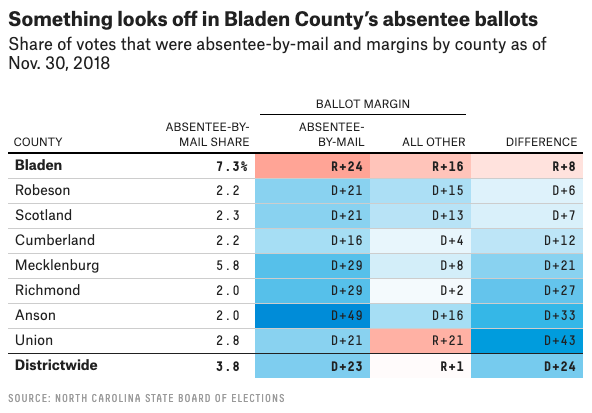
Not everything went according to plan.

Anomaly Detection
The identification of rare items, events or observations which raise suspicions by differing significantly from the majority of the data.Anomalies in NC-9
Part II
Ensemble Models
Classification Models
- Logistic Regression
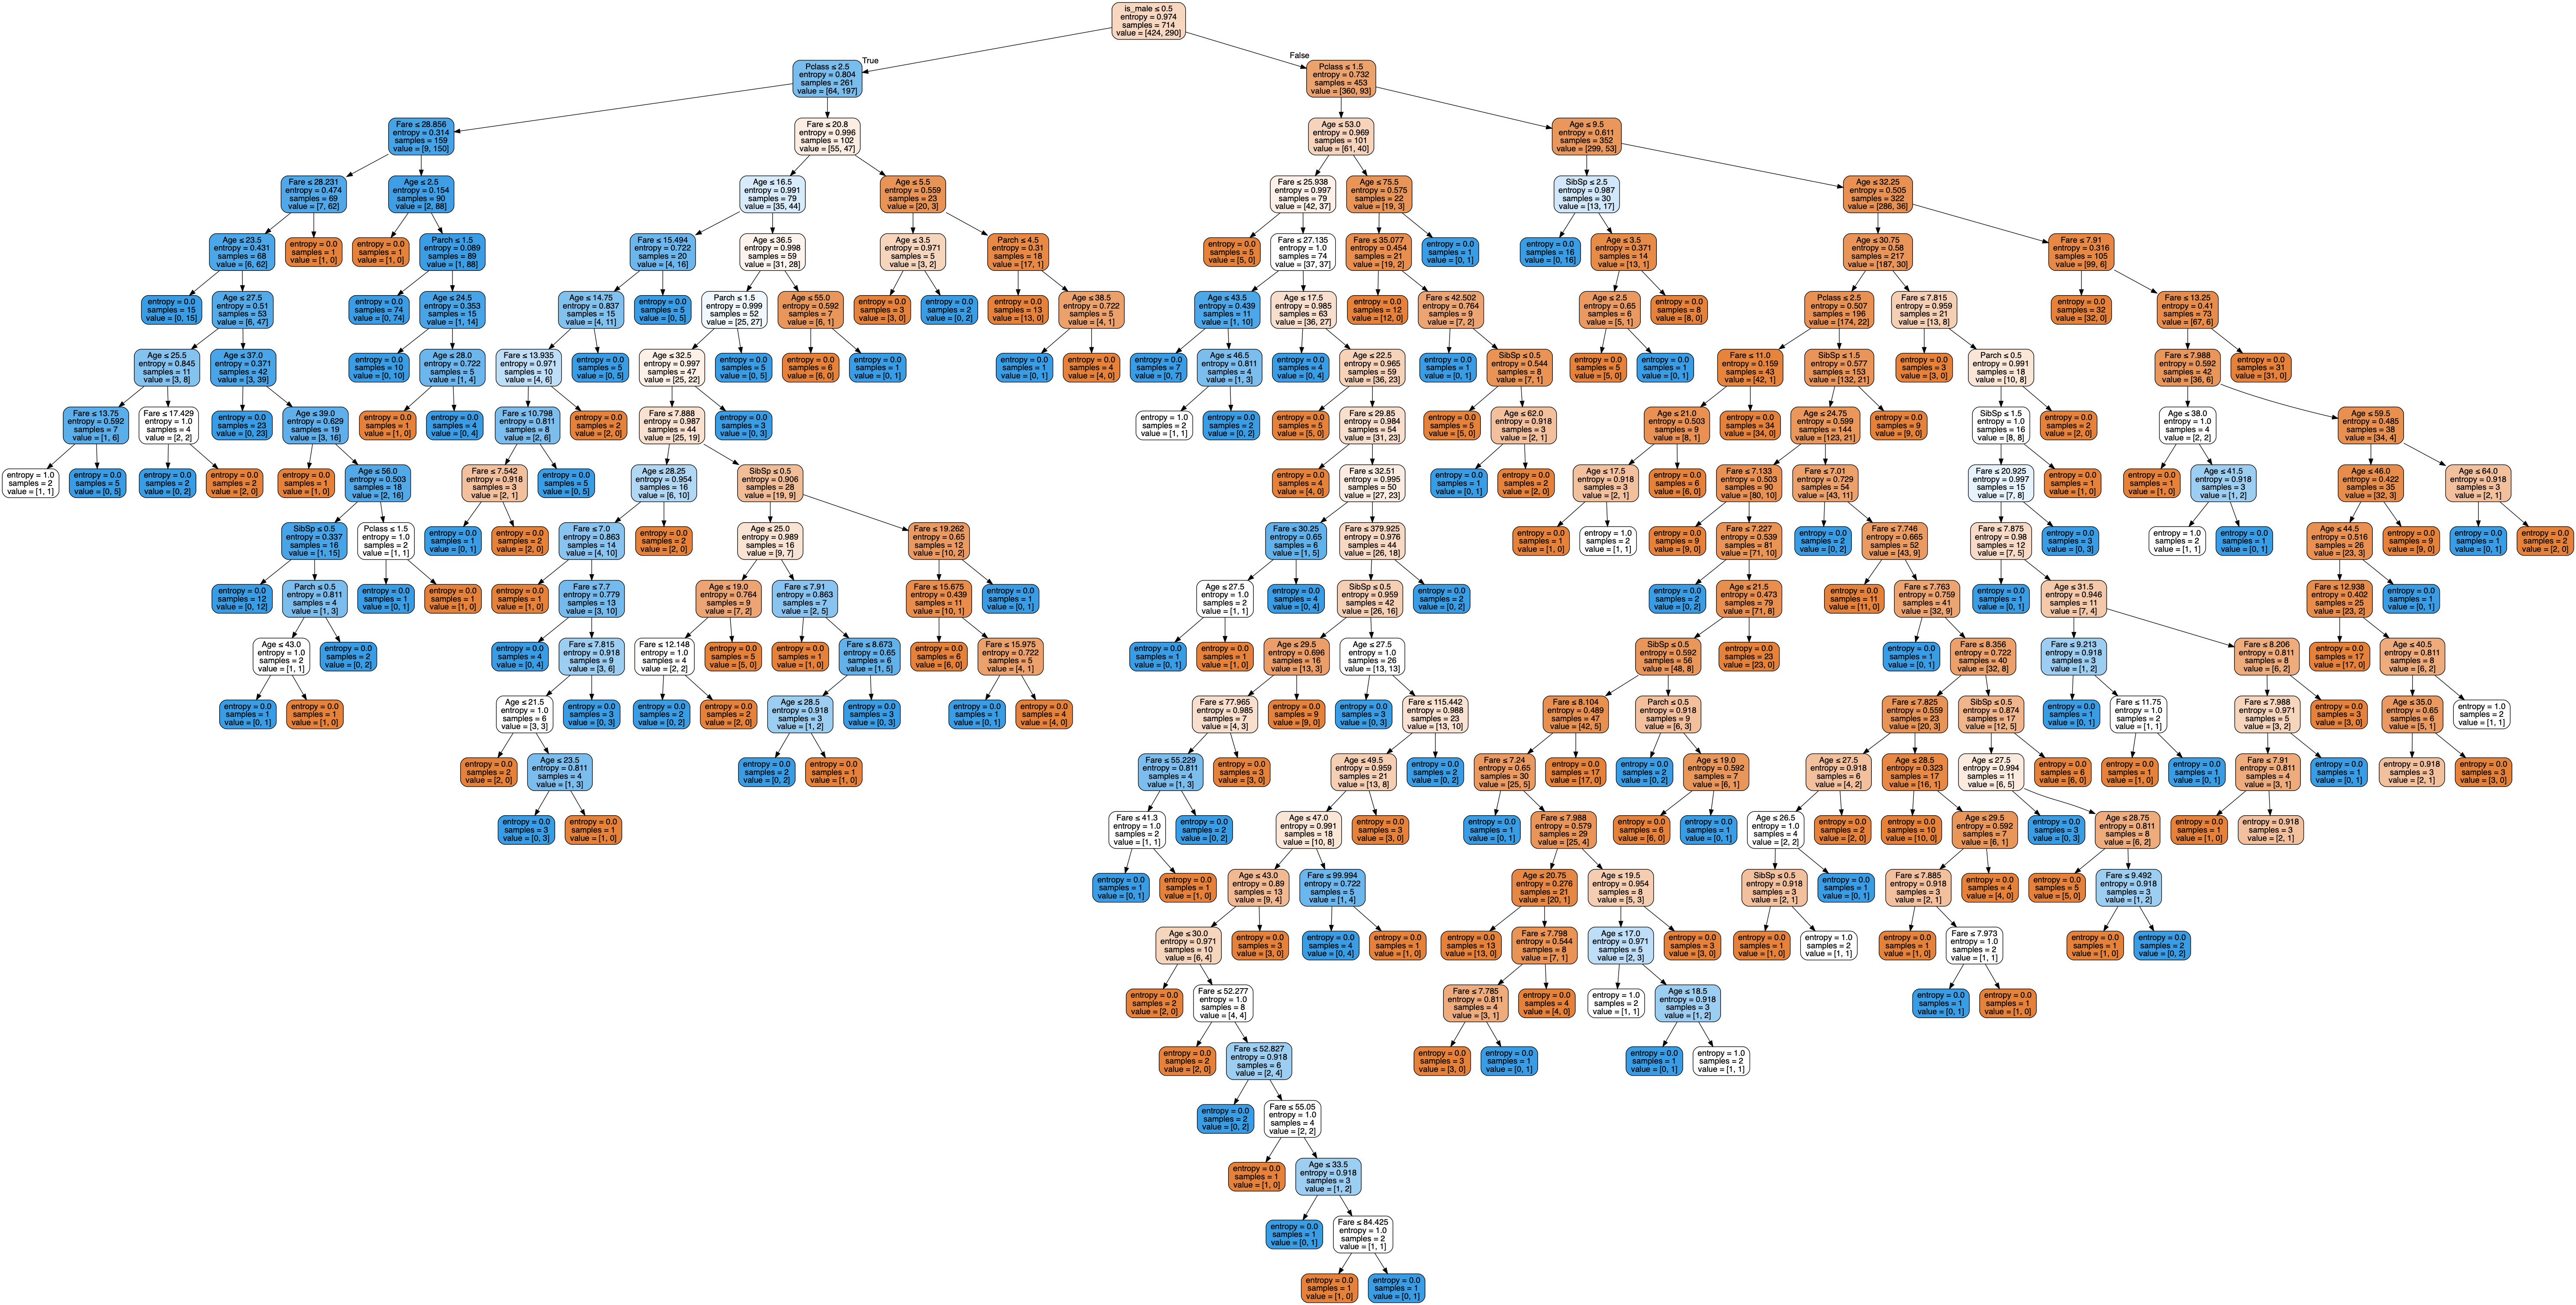
- Decision Trees
- Random Forest
- Gradient Boosting Machine
- Naive Bayes
Review: Survival Rates Among Subgroups
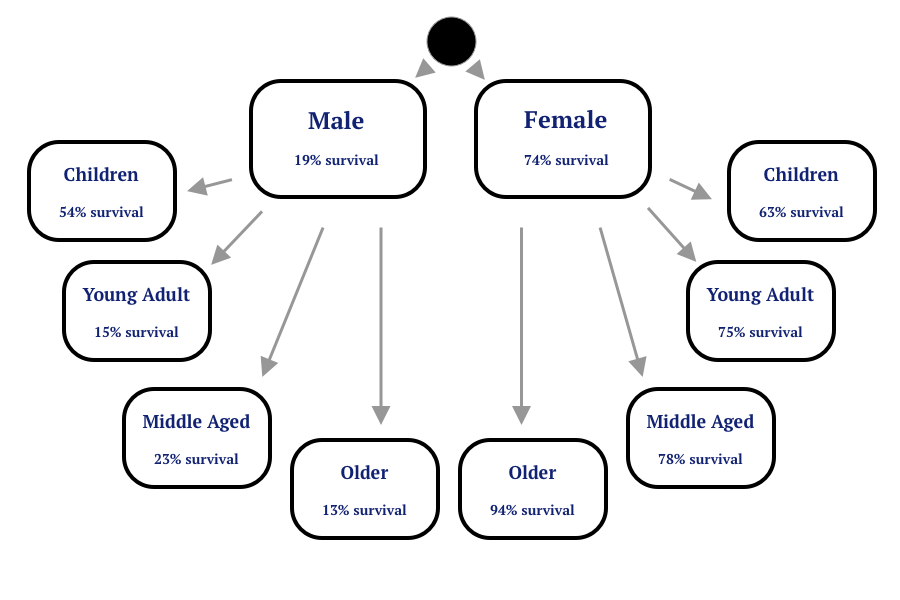
Review: Survival Rates Among Subgroups
Ensemble Models
Ensemble methods use multiple learning algorithms to obtain better predictive performance than could be obtained from any of the constituent learning algorithms alone.

Random Forests
Random Forests construct a multitude of decision trees at training time and outputting the class that is the mode of the predicted classes among each tree.
For more details.
And a nice overview of everything.
Random Forests

Gradient Boosting
Gradient Boosting produces a prediction model in the form of an ensemble of weak prediction models and then generalizes them by allowing optimization of an arbitrary loss function.
For more details.
Gradient Boosting
Demo

Midterm Exam: November 11, 6:30pm
- 90 Minute Written Exam
- No computer needed, closed book, closed notes
- Part I: Multiple Choice
- Part II: Short Answer
Week 1: What is Data Science and Why Does It Matter?
- The data science lifecycle.
- Famous case studies in data science.
Week 2: Where to Find Data
- Structured vs unstructured data.
- Common sources of data.
- Common ways to access data.
Week 3: Processing and Cleaning Data
- Elements of the ETL Process
- Processing Tools
- Data Cleaning Considerations for Data Scientists
- Missing Value
- Handling Outliers
- Normalizing Data
Week 4: Statistics and the Stories We Tell Ourselves
- Types of Data
- Useful Statistical Distribution
- Important Summary Statistics
- Independence
- Key Theorems
Week 5: Intro to Linear Models
- What Makes Linear Regression Linear
- Assumptions for Linear Models
- Measuring Performance for Linear Models
Week 6: Regression vs Classification
- Regression vs. Classification
- Logistic Regression
- Measuring Performance for Classification Models
Week 7: Tree Based Models
- Linear vs. Nonlinear Models
- Decision Trees and their Hyperparameters
- Bias vs.
- Cross Validation
Week 8: Performance Evaluation and Ensemble Models
- Lift and ROC Curves
- Random Forests and Gradient Boosting Machines
- Cross Validation
Reminder: Assignment 7 Due Monday, November 4 by 6:30pm
DataCamp's Deep Learning with PyTorch
- The course should appear collectively as assignment within your existing DataCamp account.
- Each section will appear separately and will be worth oen point toward the total grade for the homework.
- This will be the last DataCamp assignment of the semester!