City College, Spring 2019
Intro to Data Science
Week 12: Unsupervised Learning
May 6, 2019Today's Agenda
- Final Projects
- Supervised vs. Unsupervised Learning
- Clustering
- Topic Modeling
- Hacking Visualizations in Python
Final Project: Due Wednesday, May 15 by 6:30pm
- A write up of 1,200 to 1,600 words and at least 2 data visualizations on Medium.
- A fully documented repository of code on GitHub.
- An 8-10 minute class presentation with slides and visuals.
- A short project review from each team member summarizing each teammates contributions to the group effort and lessons learned through the project.
Send links to Github and Medium to itds.ccny@gmail.com by 6:30pm on Wednesday May 15.
There is a grading matrix!
- Data Science Questions (20 points)
- Data Exploration and Summarization (20 points)
- Transformation and Modeling (20 points)
- Metrics, Validation and Evaluation (20 points)
- Visualization (20 points)
- Code (20 points)
- Write Up and Presentation (20 points)
- Timely Submission (20 points)
See the project description for more details.
Do not use others' work without citation!
Peer Reviews
Each student should send me an email with each team members' primary responsibilities and overall share of contribution to the project. Should look something like this:
Dear Grant, my review on my team contributions is as follows:
- Arya: archery and assasination. 35%
- Samwell: pre-battle prep and strategy. 30%
- Hound: crucial zombie killing, but missing at key times. 25%
- Bran: spent a lot of time warging but added little to the effort. 10%
Don't be a Bran
Supervised vs. Unsupervised Learning
Supervised learning is the machine learning task of learning a function that maps an input to an output based on example input-output pairs. It infers a function from labeled training data consisting of a set of training examples.
Unsupervised learning is a branch of machine learning that learns from test data that has not been labeled, classified or categorized. Instead of responding to feedback, unsupervised learning identifies commonalities in the data and reacts based on the presence or absence of such commonalities in each new piece of data.
Clustering
Common Clustering Techniques
- K-means
- Mean shift
- Hierarchical
How would you group these points?

Visualization by Andrey A. Shabalin.
K-Means Clustering
- Choose k, a number of clusters.
- Pick k starting points.
- Assign each point to a cluster based on the closest of the k chosen points.
- Calculate the points at the center of each cluster.
- Assign each point to a cluster based on the closest of the new center points.
- Repeat steps 4 & 5 until convergence.
For more, check out these these help notes from CS221 at Stanford.
K-Means: First Try

Visualization by Andrey A. Shabalin.
K-Means: Second Try

Visualization by Andrey A. Shabalin.
K-Means: Third Try
Visualization by Andrey A. Shabalin.
K-Means: Fourth Try

Visualization by Andrey A. Shabalin.
Mean Shift Clustering
- Arrange windows to cover all points.
- Compute the number of points in each frame.
- Shift the window to the mean.
- Repeat until convergence.
These slides adapted from CS109 at Harvard.
Mean Shift Clustering
Visualization by David Sheehan.
Hierarchical Clustering
- Each observation starts in its own cluster.
- The two closest pairs form a cluster.
- Clusters are merged as one moves up the hierarchy.
- Repeat until all points belong to the same cluster.
See Wikipedia for more.
Hierarchical Clustering
Visualization by David Sheehan.
Clustering Applications
- Google Image Search Categories
- Author Clustering
- Picking Locations for Hospitals, Police Stations, etc.
- Outlier Detection
These slides adapted from CS109 at Harvard.
Clustering Application Example
Topic Modeling
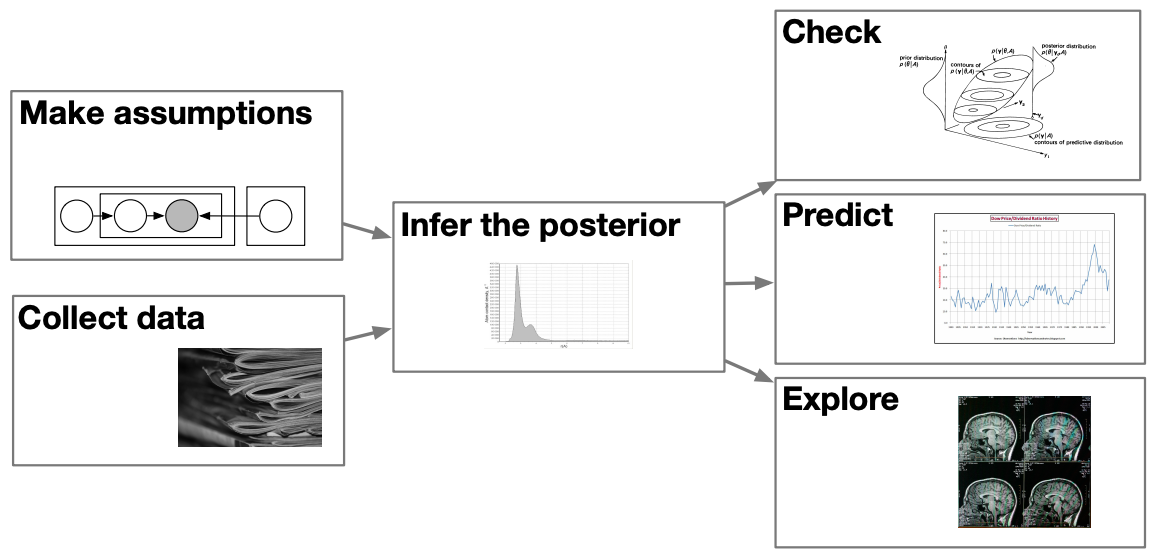
Topic modeling provides methods for automatically organizing, understanding, searching, and summarizing large electronic archives.
- Discover the hidden themes that pervade the collection.
- Annotate the documents according to those themes.
- Use annotations to organize, summarize, and search the texts.
This slide adapted from Columbia's David Blei.
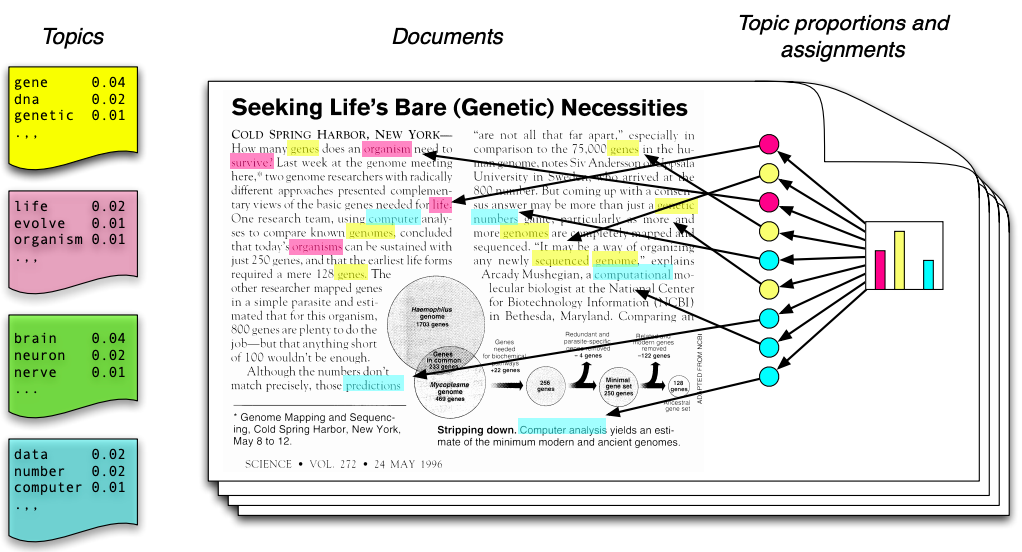
Latent Dirichlet Process for Topic Modeling
This slide adapted from Columbia's David Blei.
What topics does this passage cover?
How many genes does an organism need to survive? Last week at the genome meeting here, two genome researchers with radically different approaches presented complementary views of the basic genes needed for life. One research team, using computer analyses to compare known genomes, concluded that today's organisms can be sustained with just 250 genes, and that the earliest life forms required a mere 128 genes. The other researcher mapped genes in a simple parasite and estimated that for this organism, 800 genes are plenty to do the job - but that anything short of 100 wouldn't be enough.
This slide adapted from Columbia's David Blei.
Assigning Topics Via Machine Learning
This slide adapted from Columbia's David Blei.
Hacking Visualizations in Python
Using Altair to Create Interactive d3.js Visualizations
Topic Modeling is Hard!
We'll use Gensim to build our topic model and pyLDAvis to visualize it.