City College, Spring 2019
Intro to Data Science
Week 4: Statistics and the Stories We Tell Ourselves
February 25, 2019Today's Agenda
- Types of Data
- Useful Statistical Distribution
- Important Summary Statistics
- Independence
- Key Theorems
Week 3 Recap
- Elements of the ETL Process
- Processing Tools: Luigi, Airflow
- Handling Missing Data: Drop, Impute
HW Recap
- How was DataCamp?
- How do we feel about projects?
sta·tis·tics
noun
The practice or science of collecting and analysing numerical data in large quantities, especially for the purpose of inferring proportions in a whole from those in a representative sample.
Source
xkcd
Probability Distributions
A mathematical function that provides the probabilities of occurrence of different possible outcomes in an experiment.
SourceBinomial

describes the likelihood for k successes over n trials with p probability of success where:

Wikipedia
Normal

Wikipedia
Uniform

Wikipedia
Central Tendency
[1, 1, 1, 1, 6, 2, 4, 2, 9]

Central Tendency
Mean

Central Tendency
Median
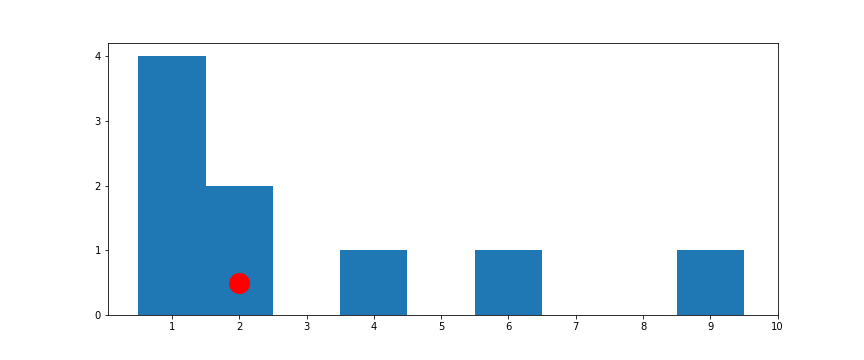
Central Tendency
Mode

Variation
Range
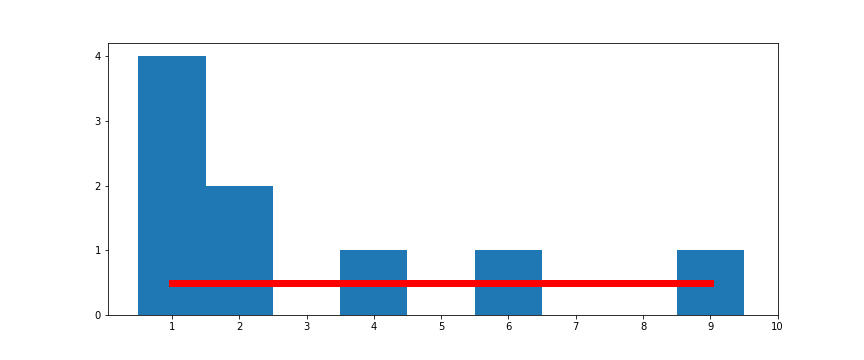
Variation
Min, Max

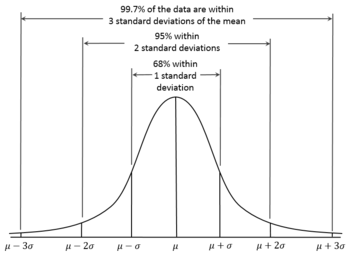
Variation
Variance, Standard Deviation
Variation
Percentiles
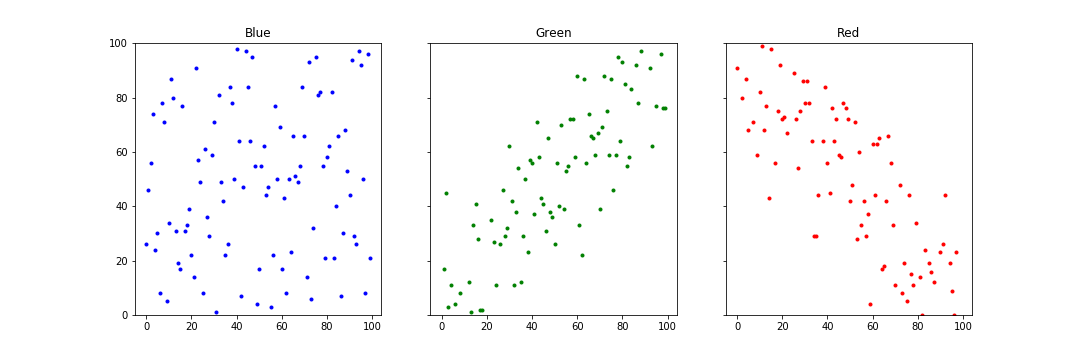
Dependence
How to describe the relationship between two distributions?
formal definition
Dependence
Covariance
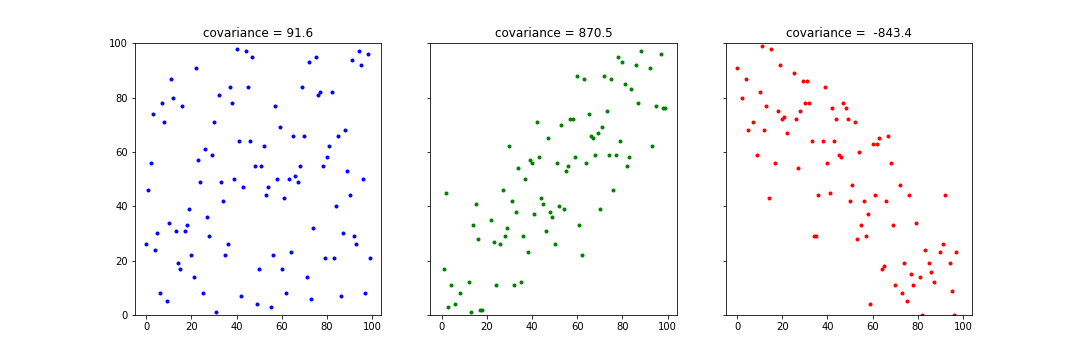
formal definition
Dependence
Correlation
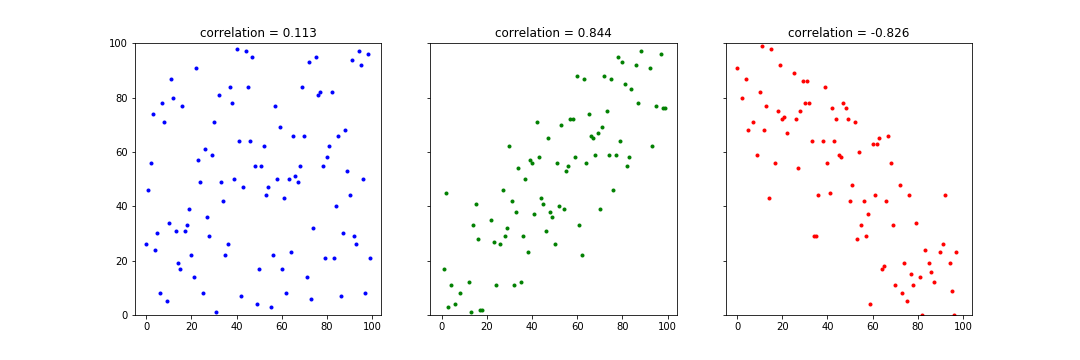
formal definition
Key Theorems
Law of Large Numbers
The average of the results obtained from a large number of trials should be close to the expected value, and will tend to become closer as more trials are performed.
Demo
Key Theorems
Central Limit Theorem
When independent random variables are added, their properly normalized sum tends toward a normal distribution (informally a "bell curve") even if the original variables themselves are not normally distributed.
Demo

Wrap Up
- Types of Data
- Useful Statistical Distribution
- Important Summary Statistics
- Independence
- Key Theorems
Reference: Data Science from Scratch
Project: Components
- Apply Python to load, clean, and process data sets.
- Identify key elements of and patterns in your data set using computational analysis and statistical methods.
- Apply principles of statistical modeling and machine learning to your data.
- Explain, visualize, and communicate empirical findings within your analysis.
- Demonstrate effective team collaboration
Project: Data Resources
- Kaggle Datasets
- Data.gov
- Google Dataset Search
- This list, and other lists on the internet
- (Legal, Responsible, Ethical) Web Scraping!
Be Creative
Project: Key Dates (Tentative)
- Project Teams Formed, February 25.
- Project Proposals Due via Email, March 18.
- Project Update, April 29.
- Projects Due, May 13.
Be Creative
Project Teams
| Team | Member 1 | Member 2 | Member 3 | Member 4 |
|---|---|---|---|---|
| Team 1 | Angelique | Nabil | Baivab | Shravan |
| Team 2 | Brandon | Haojin | Mohamed | Andy |
| Team 3 | Daniel | Carlton | Michael Tan | |
| Team 4 | Chantelle | Khristian | Ahalya | |
| Team 5 | Chieh | Melvin | Michael Li | |
| Team 6 | Andrew | Arjun | Farhan | Tadjoudine |
| Team 7 | Ana | Bon | Kirstyn | |
| Team 8 | Weicheng | Joy | Ka Shing | |
| Team 9 | Gong | Alan | Rongjun |
Assignment 4: Due Monday, March 4 by 6:30pm
DataCamp's Statistical Thinking in Python (Part 2)
- The course should appear as assignment within your existing DataCamp account.
- Course takes 4+ hours, plan your time accordingly.